


Introduction
Irrigation water is increasingly scarce and of lower quality, due to climate change, environmental pollution and growing urban or industrial demand, hence the importance of using it more efficiently (Mohan & Ramsundram, 2014; Hatfield & Dold, 2019). The Comarca Lagunera, located in northern Mexico, has faced great challenges due to its arid and semi-arid climate, since it depends on water captured in two dams and groundwater. In this region, the main limiting factor in the agricultural sector is the scarcity of water for crop production. One strategy to solve this problem is to increase the efficiency of irrigation water use. This includes the management of water from its supply source to its optimal application to the crop on the farm (Inzunza-Ibarra et al., 2014).
In the Comarca Lagunera, cotton cultivation began before 1810, with an area of more than 90 000 ha by 1962. Currently, this area has been reduced to 16 737.9 ha due to water scarcity, the high incidence of pests, diseases, high cultivation costs, and the change in land use to fodder production (Servicio de Información Agroalimentaria y Pesquera [SIAP], 2023). However, in recent years its production has increased due to its importance, since it generates jobs and is an option to replace alfalfa cultivation, which requires large amounts of water (Miranda-Wong, 2008). In this regard, Zonta et al. (2017) reported that the water deficit that causes the greatest losses in cotton yield is during the phenological periods of the first flowers and peak bloom, since the plant’s water demand is greater and its water use efficiency is low.
Singh et al. (2010), in a two-year study on the effect of water deficit on cotton, reported that using drip irrigation at 100 % evapotranspiration resulted in a 43.1 % higher yield and a 26.9 % water saving compared to furrow irrigation. He et al. (2022), when subjecting cotton to different deficit irrigations, reported that the best treatment resulted from irrigating the crop to 75 % field capacity, obtaining a yield of 7 146.4 kg∙ha-1 and water use efficiency of 1.43 kg∙m-3. Wang et al. (2014), in a three-year study of cotton grown with drip irrigation, concluded that the crop’s most sensitive stage to deficit irrigation (70 % crop evapotranspiration) was early flowering. In that study, average yield ranged from 3.6 to 5.1 Mg∙ha-1, and irrigation water productivity was from 0.91 to 1.16 kg∙m-3.
Du et al. (2008), in a two-year study conducted in an arid area of China, reported the effect of partial root-zone irrigation applied using drip irrigation on water use efficiency and cotton yield. Results showed that alternate drip irrigation had drier profiles and lower stomatal conductance values than conventional drip irrigation at the same irrigation level. However, similar yields, greater water use efficiency and a 32 % irrigation water saving were obtained compared to conventional drip irrigation. In this sense, Farahani et al. (2008), in a three-year study with the same crop, reported that the crop coefficients cited by the FAO were 24 % higher than those obtained when adjusting them to local conditions, which overestimated the water requirements of cotton by up to 150 mm, equivalent to the application of two additional irrigations.
Zhou et al. (2016) determined the amount of water to apply and the irrigation initiation time (first squares, first bloom and mid-bloom) for cotton over a four-year study period in Tennessee, USA. Results showed that starting irrigation at mid-bloom, when the highest stress occurs, yields 1 909 kg∙ha-1 of fiber, with 563 mm of water consumption. This yield is higher compared to the results obtained when irrigation was initiated at earlier stages and when a lower water deficit prevailed. Zhang et al. (2016) analyzed the effects of water deficit and plant density on the growth, yield, water use efficiency and fiber quality of cotton under field conditions. These authors found that with 400 mm of water and a high plant density, 6 300 kg∙ha-1 were obtained, which meant a water saving of 20 % by reaching 1.18 kg∙m-3 of use efficiency, the highest on average of the three years of study. Therefore, they suggest as a water-saving alternative to use high plant densities with water deficit to avoid reducing yield in arid regions.
Zhan et al. (2015), in a two-year study on the effect of deficit irrigation on cotton, reported that when compared with conventional irrigation (570 mm), deficit irrigation reduced leaf surface area in the upper canopy layer by 20 to 46 %. On the other hand, a slight water deficit (469 mm) decreased the leaf photosynthetic rate in the upper canopy layer by 24 %, but increased the photosynthetic rate in the mid-canopy layer by 23 % and in the lower canopy layer by 79 %. Therefore, Zhan et al. (2015) concluded that a slight water deficit had no significant effect on yield (7 970 kg∙ha-1) when compared to conventional irrigation (7 640 kg∙ha-1).
In more recent studies, Chen et al. (2019) concluded that a plant density of 36 plants per m2 and a water deficit of 495 mm generated yields and water use efficiency of 6 154 kg∙ha-1 and 1.44 kg∙m-3, respectively, equal to or greater than a treatment with more water. These authors point out that a higher plant density with deficit irrigation increased the efficiency of use of limited resources, such as light intensity and available water. Çeltin and Kara (2019) reported that the highest water productivity in cotton (0.84 kg∙m-3) was achieved with subsurface drip irrigation at a 40-cm lateral pipe depth and with 528 mm of water.
Considering the regional and national purpose of improving water use efficiency in different crops, the objective of the present study was to determine the response function of the cotton crop to different soil moisture contents as well as water use efficiency.
Materials and methods
The study was carried out in an experimental plot of the National Center for Disciplinary Research on Water-Soil-Plant-Atmosphere Relationships belonging to the National Institute of Forestry, Agriculture and Livestock Research (CENID RASPA, INIFAP), located in the Comarca Lagunera, Gómez Palacio, Durango, México (103° 25’ 57’’ WL and 25° 31’ 57’’ NL, at 1 139 m a. s. l.), in the southeastern part of the state of Coahuila and the northwestern part of Durango, bordering the state of Chihuahua to the north and Zacatecas to the south.
The Comarca Lagunera has a desert-like climate classified as BW(h’)hw(e) (García, 2004), with low atmospheric humidity, average annual rainfall of 200 to 300 mm in most of the region and 400 to 500 mm in the mountainous area to the west. Rainfall is mainly in summer, with some winter rains accounting for 5 to 10.2 % of the total. It has an average annual evaporation of 2 600 mm, and average annual and coldest month temperatures of 20 and 18 °C, respectively. The frost-free period is between April and October, and hailstorms may occur in May.
The physicochemical characterization of the experimental site’s soil was carried out by means of a series of sampling pits in the form of a grid with four replications and three depths (from 30 to 90 cm). The main chemical characteristics determined were the availability of nitrates (NO3; Kjeldahl method), phosphorus (P; Duval method) and potassium (K; spectrophotometry), total carbonates (CO3; volumetry), electrical conductivity (EC; conductimetry), cation exchange capacity (CEC; with gypsum extraction) and the pH (saturation paste) (Table 1).
Table 1.
| Depth (cm) | NO3 (mg∙kg-1) | P (mg∙kg-1) | K (mg∙kg-1) | CO3 (g∙kg-1) | EC (dS∙m-1) | CEC (cmol∙kg-1) | pH |
|---|---|---|---|---|---|---|---|
| 0-30 | 23.18 | 9.20 | 1045.83 | 53.0 | 0.79 | 24.4 | 8.47 |
| 30-60 | 37.27 | 8.23 | 912.50 | 68.0 | 1.07 | 23.5 | 8.30 |
| 60-90 | 43.42 | 9.67 | 833.30 | 86.6 | 1.03 | 23.4 | 8.15 |
The soil’s physical characteristics (Table 2) were determined using different techniques: organic matter content (OM; Walkley and Black method), sand, silt and clay content (Robinson’s pipette method), field capacity (FC; pot method), permanent wilting point (PWP; pressure membrane) and bulk density (Da; cylinder method) (Plenecassage et al., 1977). In general, the soil of the experimental site contained low nitrate availability, moderately low phosphorus availability and high potassium availability, as well as low contents of soluble salts, sodium and organic matter (Castellanos et al., 2000).
Table 2.
| Depth (cm) | OM (%) | Sand (%) | Silt (%) | Clay (%) | Texture | FC (%) | PWP (%) | Da (g∙cm-3) |
|---|---|---|---|---|---|---|---|---|
| 0-30 | 1.21 | 20.0 | 38.0 | 24.0 | scl | 27.9 | 15.9 | 1.3 |
| 30-60 | 0.88 | 19.6 | 47.4 | 33.0 | scl | 27.7 | 15.5 | 1.2 |
| 60-90 | 0.82 | 17.0 | 50.0 | 33.0 | Loam | 27.9 | 15.2 | 1.3 |
To determine the available moisture consumed (AMC), the methodology used by Inzunza-Ibarra et al. (2022) was applied, consisting of a two-factor study with four levels of AMC (40, 60, 80 and 100 %) at two phenological stages of the crop (germination to the onset of flowering, and from there to physiological maturity). The San Cristobal two-factor treatment design was used, in which seven treatments are chosen from a total of 16 combinations (4×4) (Martínez-Garza, 1988). According to this design, seven different levels of soil AMC abatement in the first 90 cm of crop root depth were studied: 40-40, 40-80, 60-60, 60-100, 80-40, 80-80 and 100-60 % AMC.
The treatments were randomly distributed in the field based on a randomized block experimental design with four replications. The experimental plot was 4 m wide by 5 m long, giving an area of 20 m2. To monitor soil moisture content and its variation throughout the crop cycle in each treatment, the time domain reflectometry (TDR) method was used with the aid of a Trime-Pico T3/IPH44 sensor (IMKO, Germany). Cotton was planted on March 25, with a planting density of 12 kg∙ha-1 (approximately 131,000 plants∙ha-1) and N-P-K fertilization (130-80-0). The cotton variety planted was Bayer FM 1740 B2RF.
The evaluated variables cotton yield (lint and seed (Mg∙ha-1), the amount of water consumed, water use efficiency (which relates grain yield to the amount of water consumed; kg∙m-3) and the soil moisture content of each treatment.
Results were subjected to an analysis of variance, comparison of means (Tukey, α ≤ 0.05), regression analysis and optimization of variables, by deriving to maximize and minimize (Statistical Analysis System [SAS], 2003).
Results and discussion
Table 3 shows the values of the moisture levels to which the different cotton crop treatments were subjected. The AMC fluctuated from 42 % at the first growth stage in the 40-40 and 40-80 treatments (non-restrictive moisture conditions) to 100 % in the 100-60 and 60-100 treatments (extremely restrictive water conditions) at the first and second stages of cotton growth, respectively. In the case of actual evapotranspiration or amount of water consumed by the cotton plant, the highest water consumption (64 cm) in the first stage occurred in the 40-40 and 40-80 treatments, and the lowest water consumption (29 cm) was observed in the 100-60 treatment (low moisture content in the vegetative stage of cotton).
Table 3.
| Treatment | AMC1 (%) | AMC2 (%) | ET1 (cm) | ET2 (cm) | Y (Mg∙ha-1) | WUE (kg∙m-3) |
|---|---|---|---|---|---|---|
| 40-40 | 42 | 44 | 64 | 52 | 8.21 a | 0.707 |
| 40-80 | 42 | 82 | 64 | 37 | 6.19 c | 0.612 |
| 60-60 | 63 | 62 | 53 | 44 | 8.67 a | 0.897 |
| 60-100 | 63 | 100 | 53 | 34 | 5.30 d | 0.610 |
| 80-40 | 81 | 44 | 41 | 52 | 7.14 b | 0.767 |
| 80-80 | 81 | 82 | 41 | 37 | 7.37 b | 0.945 |
| 100-60 | 99 | 62 | 29 | 42 | 5.89 cd | 0.830 |
Cotton yield with different irrigation treatments
Figure 1 shows the behavior of cotton seed yield (Mg∙ha-1) in response to different soil moisture conditions. The analysis of variance showed highly significant differences (α = 0.01) among treatments (Table 4). The 60-60 AMC combination generated the highest average yield (8.67 Mg∙ha-1). According to the comparison of means (Table 3), this yield was not statistically different from that achieved with the 40-40 treatment. Both treatments were significantly higher than the rest (α ≤ 0.05).

Table 4.
| Source of variation | df | Yield (Mg∙ha-1) | WUE (kg∙m-3) |
|---|---|---|---|
| Blocks | 3 | 0.1817 | 0.0025 |
| Treatments | 6 | 6.1167** | 0.0698** |
| Error | 18 | 0.0893 | 0.0014 |
| CV (%) | 4.29 | 4.86 |
The highest cotton yield was obtained when applying irrigation at 63 and 62 % (Figure 1) AMC; this occurred when the soil presented a tension of -0.48 and -0.46 MPa to extract soil moisture in the first and second stages of cultivation, respectively. The yields obtained are similar to those reported by Singh et al. (2010), and 38 % higher than those achieved by Li et al. (2019).
The lowest yields were observed in the 60-100 and 100-60 treatments (5.30 and 5.89 Mg∙ha-1, respectively), which had in common water stress conditions close to the PWP at one of their stages (Figure 1). According to the comparison of means (Table 3), these treatments turned out to be statistically lower in cotton yield compared to the rest, but with no significant differences among them. Liu et al. (2017) report yields lower than 3.1 Mg∙ha-1 under similar soil stress conditions.
These results allow concluding that there is no linear response of cotton yield under different soil moisture regimes. That is, a negative effect on yield was observed, both for water stress levels and for very wet levels in the soil that can produce prolonged anaerobiosis conditions (Liu et al., 2018).
Cotton production model considering the soil moisture regime
By means of regression analysis, the observed cotton yield (Y) data were fitted as the dependent variable and AMC at the time of irrigation as the independent variable, which generated the following function:
where the regression coefficients of each of the effects (linear, quadratic and interaction) were highly significant and contribute to explaining the cotton yield. According to the coefficient of determination (R2) and the coefficient of variation (CV), the model obtained satisfactorily explains the phenomenon represented. By using the theory of maxima and minima of differential and integral calculus (Hasser et al., 1982), it is deduced that the maximum cotton yield (8.7 Mg∙ha-1) is obtained when irrigating until the soil reaches, on average, 59 and 56 % AMC at the growth and reproductive stages, respectively. These critical values are equivalent to 0.46 and 0.36 MPa soil moisture tension, respectively.
Cotton yield model considering evapotranspiration or the amount of water consumed
When relating the yield and evapotranspiration of the cotton crop of each treatment, a quadratic type relationship was observed (Figure 2), which resulted in Equation 2, where the estimated regression coefficients were significant and contributed to explaining the relationship of the variables under study.
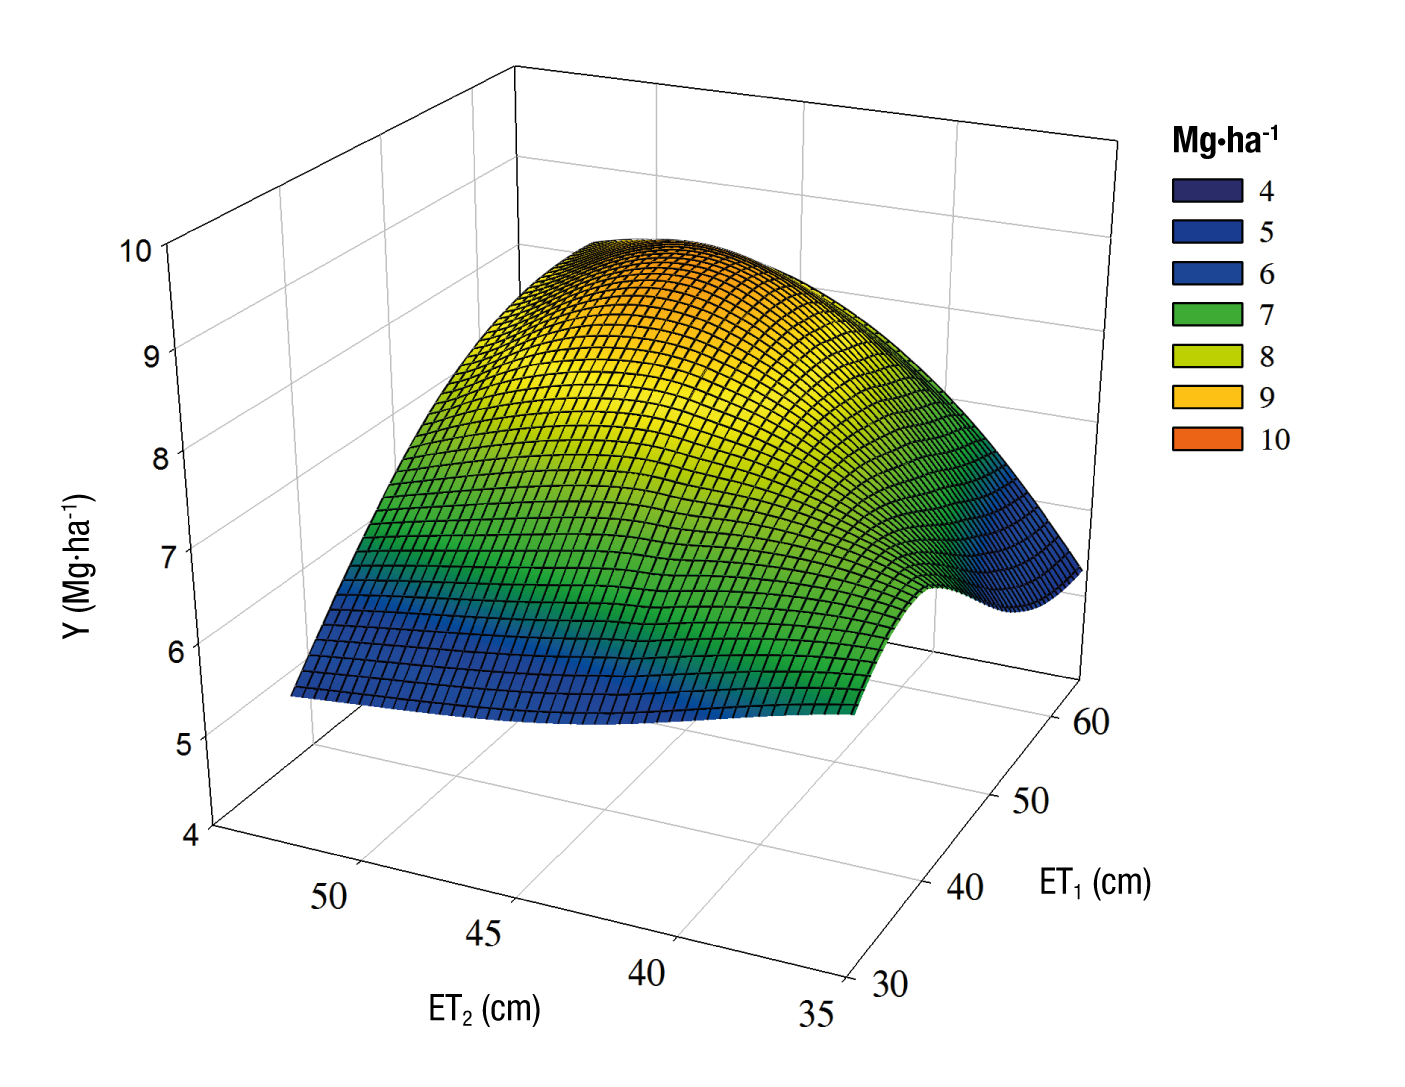
According to the statistical parameters found, the model presents a satisfactory predictive capacity for these types of complex biological relationships, where several plant, soil and environmental factors are involved.
Conclusions
According to the generated model, which relates cotton yield and soil moisture levels, the crop maximizes its production (8.74 Mg∙ha-1) when it develops with a soil water deficit of 59 and 56 % AMC at the vegetative and reproductive stages, respectively. Optimization of the function that related yield to the amount of water consumed showed that the maximum yield occurs when the crop consumes 54.3 and 46.6 cm of water during the vegetative and reproductive stages, respectively. The highest water use efficiency (0.945 kg∙m-3) was observed under water conditions of 81 and 82 % AMC, and water consumption of 41 and 37 cm at the vegetative and reproductive stages, respectively. It is inferred that the response of cotton to different soil moisture contents is not linear, but rather obeys an optimum, which is of great importance in the planning of water resources in the arid and semi-arid regions of the country, since it represents water savings. This study allows applying the deficit irrigation concept, by analyzing the proximity of the optimal response function and observing the decrease in the amount of water applied to the crop without significantly affecting yield.